|
|
SID MONITORING STATION |  Today Sampling : 26/01/2013 | 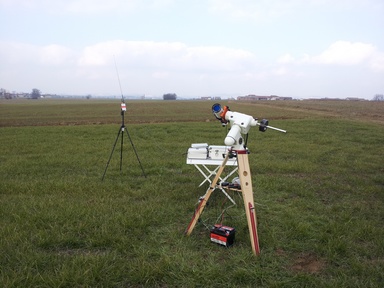 | For the first time the mobile station is fully operational. Today i' reached a good place for radio sampling with the E202 and the Ha Scope, the Lunt BF600. The first thing i was notice was the incredible difference between a good site without radio/electrical interferences and the old one with high tension at 2 km away: another dimension of VLF data capturing. The downside is that i can't sample in the same time the Neq6 mount is working! At just 4 meters the mount noise is incredible (see below.) , from 30 Hz to 6375 Hz it's like to have a tractor nearby!
Sampling example #1 : The right place for sampling (very low noise) : http://www.astrophoto.it/gallery/vlf/26012013/spex1.jpg Record : http://chirb.it/wh1OL4
Sampling example #2 : Neq6 Mount at 4 meters tracking the sun : http://www.astrophoto.it/gallery/vlf/26012013/spex3eq.png Record : http://chirb.it/hbK9Ds
Sampling example #3 : Car Engine on (3 meters) : http://www.astrophoto.it/gallery/vlf/26012013/enginestart.png Record: http://chirb.it/BgL6II
In the meanwhile , i have tried to gain some picture of the sun with the Lunt and the PGR ccd. The sky wasn't clear and there were a lot of turbulences causing a bad seeing too. For the first time i set the sampling to 640x480 with 30Hz to achieve the maximum framing available by the ccd. All pictures are available in the Sun gallery ( http://www.astrophoto.it/photoalbum/index.html )
|
|  |  Today Sampling : 18/01/2013 | 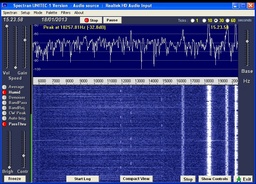 | I was wrong because the sampling of Spectran was on a "sampling rate" (in the options "controls" at the bottom) of 11025 (default), which was too low and could not solve the signals well above 5Khz. After setting it at 44100, immediately appeared me mixed traces of likely military RTTY and Russian ALPHA navigation system-The monitoring of the ionosphere today and spectrogram analysis will be published as soon as possible. I'm trying to go on the road of automating the process of collecting data by connecting the receiver to a little server that i have at home. Unfortunately, the reception is strongly distorted by a low voltage, so for now I can sample only for a few hours a day while I'm at lunch or in the evening! Click refresh button in next few days to see the results. the linear dotted lines that can be seen from 12000 Hz are those of Navigation Network for Russian submarines called ALPHA (= OMEGA Nato)
NOAA / Space Weather Prediction Center of today : www.astrophoto.it/gallery/vlf/noaa1.gif (Taken from NOAA at : http://www.swpc.noaa.gov/rt_plots/kp_3d.html )
Data Records 18/01/2013 :
http://chirb.it/dwOvM7
Other data registration 18/01/2013 available (but not uploaded due to big size)
|
|  Radio pollution | 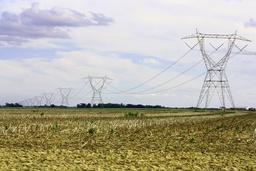 | This evening i was sampling in particular zone near Turin, a mount that was an ancient volcano. I realized too late the presence of high voltage pylons at 500 meters (546 Yards) from me... i wasn't able to record almost nothing. I realized how difficult it's to find a good place for sampling near a city , due to radio pollution with which we are in contact every day. Even at home you can not record because of the 50Hz low-voltage of the national electricity company. To give a better idea of what I'm talking about here are two examples:
1) Last record, a quite good place, no electrical lines near : http://chirb.it/7Ch7Ax
2) High tension , half Kilometer away from the receiver : http://chirb.it/L6DM9f
In any case, this in some way reminds me of light pollution that plagues amateurs astronomers every time and force them to shift to increasingly dark skies, far and unfortunately much more rare. |
|  Testing the receiver. | 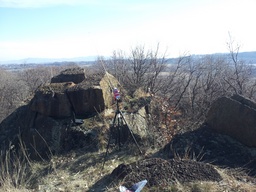 | 14/01/2013
What we are looking for? VLF stands for (Very Low Frequency) , in a simple way we are monitoring "radio nature"! Very low frequency or VLF refers to radio frequencies (RF) in the range of 3 Hz to 30 kHz and wavelengths from 10 to 100 kilometers. Since there is not much bandwidth in this band of the radio spectrum, audio (voice) cannot be transmitted, and only low data rate coded signals are used. The VLF band is used for a few radio navigation services, government time radio stations which broadcast time signals to set radio clocks, and for secure military communication. Since VLF waves penetrate about 40 meters into saltwater, they are used for military communication with submarines. But also our earth live in this range of frequency. The goal is to investigates the Earth's electrical environment, its upper atmosphere, lightning discharges, radiation belts, and the ionized regions of upper atmosphere known as the ionosphere and magnetosphere. Much of the work involves the use of very low frequency (VLF) electromagnetic waves which are generated by lightning discharges, by man-made transmitters and by energetic radiation belt electrons.
The most interesting phenomena are listed here : http://www.vlf.it/nrs/nrs.htm and here http://www.home.pon.net/785/natural.htm
This is my first VLF radio radio recording : http://chirb.it/7Ch7Ax Spectrogram : www.astrophoto.it/gallery/vlf/s1.png
Many spherics were captured and also my first tweek! : www.astrophoto.it/gallery/vlf/t1.png
Many thanks to Re Claudio ( http://www.comsistel.com/ ) Renato Romero (www.vlf.it) for supporting me in this first recording/analyse steps.
|
|  Software and cables | 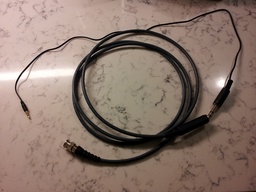 | 13/01/2013
Ok , we are ready to begin! I would like to spend just few words on software. There is a wide variety of software on the web, but fortunately, best ones are almost all freeware and allow you to have a good sampling, using just a simple computer sound card as an oscilloscope.. One of the bnc / f outputs of the Explorer, has the ability to Line IN / OUT, then welding a coaxial cable about 2 feet (but you can also do longer) end with two wires taken from an mp3 headphone with the classic male jack to connect it to your computer. Care must be taken not to sample too close to the computer as they transmit at the same frequencies that we are going to listen. If the computer is a laptop, preferably 5 meters if a netbook battery 2 meters. are enough . (but always depends on the manufacturer -- see the picture for the cable)
Software objective is based primarily to display the spectrogram and must have the ability to record *.wav files . Then , data must be processed with another specific software: Sonic Visulizer. For the analysis of data and for recording, the best SW are:
- Spectrum lab (http://www.qsl.net/dl4yhf/spectra1.html) The most complete software on web. It's also more difficult to use, not for beginners.
- Spectran ( http://digilander.libero.it/i2phd/spectran.html) Easy and basic, an exellent software in every way.
- Sonic Visualiser ( http://www.sonicvisualiser.org/) Best elaboration signal software for post-processing / monitoring.
|
|  Retrieve the appropiate instrumentation : The Explorer E202 | 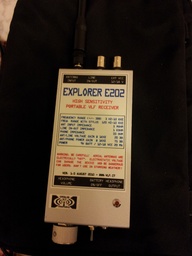 |
The Explorer E202 is a portable receiver of electric field VLF high sensitivity for radio signals of natural origin.
I chose this model for two reasons:
1) Portability (low power consumption, use of battery standards, great reception gain)
2) Excellent resolution in the range 3 Hz - 10 kHz, + / - 3 dB.
This is just the beginning of a long journey that I hope we can add to the Lunt BF600 to create solar observatory as complete as possible. Special Thanks to Re Claudio e Renato Romero for help and support .
SPECIFICATIONS
· Frequency response with antenna supplied stylus: 120 Hz - 10 kHz, + / - 3 dB
Frequency response of low impedance: 3 Hz - 10 kHz, + / - 3 dB
· Internal Power: 9V alkaline battery, with a duration of about 40 hours.
· External power supply: 12 to 18 VDC (20 mA)
· Protection against reverse battery polarity.
· Protection against reverse polarity of the external.
· Headphone output: impedance 33 ohms (headphones included)
· LINE line with dual function: signal output to the line input of the PC signal input
if you want to use the receiver as a tester for other audio devices. The signal injected into the
LINE is returned amplified headphones.
· Antenna input: 5 Mohm input impedance.
For more info about this VLF receiver please visit : http://www.comsistel.com/ |
|
|
|
|
|

